Economy, the Fed, and Rates…
March 10, 2026
Economic Data & Labor Market
- February payrolls shocked: −92,000 jobs vs. +55,000 consensus. The unemployment rate rose to 4.4%. Prior months were revised lower by a combined 69,000—turning December into a loss (−17,000 from an initial +48,000 estimate) and pulling the three-month average to near-zero (+6,000/month). Private-sector payrolls fell 86,000. The labor market has now shed jobs in five of the past nine months. Bloomberg Economics’ Alt-Data Labor Market Index, built specifically because of BLS data-quality concerns, reads ~0.3 standard deviations below the historical average—still weak but improved from ~0.7 SD below at its September trough. Stripping out strikes, weather, and BLS model effects, the underlying pace is roughly 60,000–70,000 jobs per month.
- Weakness was broad-based, and the labor market’s sole engine stalled. Healthcare and social assistance—the only sector reliably adding jobs for two years—shed 19,000 positions, dragged down by a 31,000-worker Kaiser Permanente strike. Even stripping out the strike, the sector’s reversal from +116,000 in January underscores fragility. Leisure and hospitality cut 27,000, construction lost 11,000, manufacturing shed 12,000, and the information sector extended a multi-year slide (>300,000 jobs lost since late 2022). The unemployment rate for high-school-only workers 25+ rose to 4.8%; bachelor’s-degree holders held at 3.0%. Among men 22–27, college graduates now face roughly the same unemployment rate as non-graduates—a sign the degree premium has collapsed.
- Wages solid; productivity absorbing the pressure. Average hourly earnings rose 0.4% m/m, 3.8% y/y. But unit labor costs were up just 1.3% in 2025, thanks to 2.8% productivity growth—double the pre-pandemic pace. Wages remain firm on the surface, but productivity is keeping labor-cost inflation benign. This is the channel that connects to Barclays’ supercore thesis below.
- ISM Services surged to 56.1—the strongest since mid-2022. New orders hit a one-year high (58.6), backlogs jumped an unprecedented 11.9 points, and fourteen of seventeen industries expanded. Notably, services prices-paid fell to a near one-year low—a sharp contrast with ISM manufacturing, where input prices soared to their fastest pace since 2022. The divergence—robust services alongside collapsing payrolls—suggests the headline NFP number overstates underlying weakness, though the breadth of losses argues against dismissing it entirely.
Federal Reserve Policy & the Growth/Inflation Squeeze
- The Fed’s dual-mandate collision is no longer hypothetical. A weak payroll report would normally pull cuts forward. Instead, the Iran shock prevented a clean dovish repricing. Officials hold at 3.50%–3.75% and are expected to stand pat at the March 17–18 meeting. Swaps price ~35–50 bps of total 2026 easing, down from ~60 bps a week earlier, with first-cut timing oscillating between July and September. Bloomberg Economics maintains a 100-bps-of-cuts call. Governor Miran continues to argue for aggressive easing; Cleveland Fed’s Hammack won’t rule out hikes if inflation stalls. Goolsbee compared the risk of repeated supply shocks eroding expectations to a sunburn: once you see the damage, you regret not having applied protection. Watch: Powell’s term as chair ends mid-May, making the April 28–29 FOMC his last meeting—and a live possibility for a cut if March payrolls are also negative.
- The key question is duration, not direction. A short-lived oil shock is something the Fed can look through; persistent $100+ oil risks lifting headline PCE at or above 3.0% through 2026 (Morgan Stanley estimates a sustained 10% oil increase adds 30–40 bps to y/y inflation). JPMorgan estimates $90 oil would trim GDP by 0.6 pp—but September futures traded at $73, implying the market expects the shock to fade. Minneapolis Fed’s Kashkari explicitly warned against “transitory 2.0.”
- Barclays’ AI-disinflation thesis: a medium-term wildcard. If core goods drift to ~0% and rent inflation runs below its pre-COVID norm, supercore must run hotter just to keep core CPI near 2%. But wage growth has already decelerated to pre-COVID pace—and AI-driven labor substitution could push it lower still. Barclays argues that markets should price in a negative core inflation risk premium beyond the near term, not a positive one. The note itself was largely drafted by AI, which Barclays cited as evidence of the thesis in action.
Treasury Yields & Bond Markets
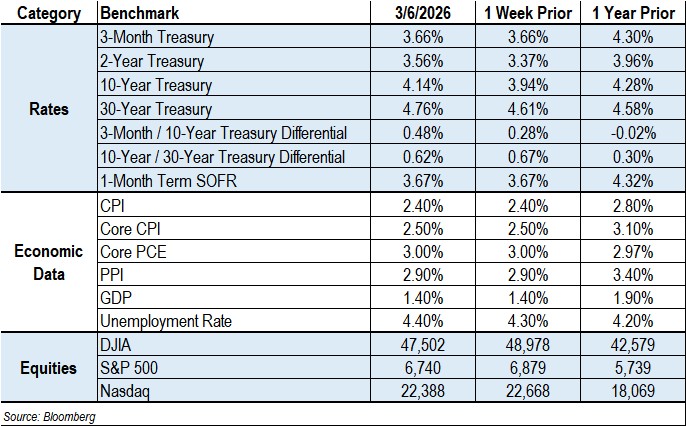
- Worst weekly rout since “liberation day.” The 10-year finished at 4.14%, up 20 bps w/w. The 30-year rose 15 bps to 4.76%; the 2-year climbed 19 bps to 3.56%. The bond market’s muted reaction to the payroll miss—yields barely moved on the data—signals inflation anxiety is dominating growth concerns.
- Real yields, not break-evens, drove the move. Ten-year real yields rose ~14 bps on the week versus only ~6 bps for breakeven inflation. That distinction matters: the market was not just pricing near-term gasoline inflation—it was repricing the real-rate path, term premium, and the Fed’s room to ease. In plain terms, bonds sold off because the macro setup got uglier, not simply because oil went up.
- Safe havens failed. Treasuries, gold, yen, and Swiss franc all declined while the dollar rallied ~1.4%. Stocks and bonds fell together for the worst combined week since April. Barclays found the stress gap between the most and least volatile assets has never been this wide in the data back to 2010. The U.S. fared better than energy importers: UK gilts posted their worst week since the 2022 pension crisis (+39 bps), and short-term German yields jumped 30 bps.
- Fiscal trajectory darkens. CBO projects federal debt surpassing $56T by 2036 (120% of GDP), and this week added $2T to its decade-long deficit forecast. The war’s first 100 hours cost an estimated $3.7B (CSIS). Hormats (Barron’s) warned the erosion of international trust could make the next financial crisis far harder to manage cooperatively than 2008.
Dollar, Commodities & Market Dynamics
- Dollar up, gold down. The Bloomberg Dollar Spot Index rose ~1.4% w/w, reflecting the U.S.’s net-energy-producer advantage and risk-off positioning—inverting the “liberation day” pattern when the dollar fell alongside everything else. Gold fell 2.3% to $5,159/oz (worst week since January 30); silver dropped 9.3%. The stronger dollar and higher rate expectations overwhelmed safe-haven demand.
- Oil posted its largest weekly gain on record. WTI surged 36% to $91/bbl; Brent rose 27% to $93. The Strait of Hormuz is effectively shut—fewer than 50 ships transited (vs. hundreds normally), ~500 tankers stuck nearby. Kuwait is cutting production due to a lack of storage; Iraq has reduced output; Qatar has stopped producing LNG. Container bookings into Gulf ports plunged 81% in two days; port congestion at India’s Nhava Sheva surged from 10% to 64% in a week. Goldman warned prices would exceed $100 next week absent de-escalation, calling the disruption 17× larger than the worst Russia-related supply cut. Diesel is up >50%; jet fuel topped $200/bbl in parts of the world; European gas is up nearly two-thirds.
- Administration options are limited. The Strategic Petroleum Reserve (SPR) remains depleted; officials say a release is not on the table. Treasury eased sanctions on Russian oil to India. A $20B Development Finance Corporation (DFC) reinsurance scheme for Hormuz tankers drew industry skepticism—shipowners said insurance is secondary to crew safety. API’s CEO stated the only real solution is clearing the strait militarily.
Equities, Private Credit & AI
- Stocks posted their worst week since October. S&P 500 −2% w/w, Dow −3% (worst since April), Nasdaq −1.2%. VIX surged toward 30, signaling acute near-term fear. IG credit spreads widened to a three-month high. Hedge funds slashed net exposure to levels not seen since 2022.
- Private credit cracks widened. BlackRock limited withdrawals from a $26B flagship private-credit fund for the first time (−7.7% on shares). Wells Fargo flagged that bank loans to non-depository financial institutions (NDFIs) have grown from 5% to 14% of total bank loans over the past decade, with concentrations in private equity, private credit, and fund banking lines.
- AI capex signals whipsawed. Oracle/OpenAI scrapped a Texas data center expansion; Marvell bucked the trend, citing faster-than-expected demand. Block laid off 40% of employees, explicitly citing AI—giving corporate form to the labor-substitution thesis. Whether the >300,000 information-sector and ~500,000 professional-services job losses since 2022–2023 are cyclical or structural will determine the wage-growth path and the supercore trajectory Barclays flagged.
CRE Finance Market Implications
- Floating-rate relief delayed—not canceled. The rate-cut timeline has shifted from July to September at the earliest, with total 2026 easing compressed from ~60 bps to ~35–50 bps. Borrowers with near-term maturities face a tighter window.
- Energy costs hit the property stack directly. Diesel up 14–17% in a week flows into construction delivery, materials transport, and operating budgets. Asia-to-U.S. airfreight up 60% is putting pressure on building materials and FF&E. Port congestion is building across Asia, signaling bottlenecks that could persist after hostilities end. If oil stays above $90, the IMF estimates a 40-bp increase in global inflation and a 0.1–0.2% drag on growth—the stagflationary mix that simultaneously widens cap rates and compresses NOI.
- Private credit stress introduces lender-side risk. If credit stress migrates from private credit to the banks that fund it (NDFI exposure now 14% of total bank loans, up from 5% a decade ago), underwriting appetite for transitional CRE—which depends on non-bank capital—could tighten further.
- Safe-haven failure reshapes capital allocation. When stocks, bonds, gold, and traditional hedges all fall together, institutional investors rethink diversification. Whether capital flows toward CRE’s contractual cash flows or away from illiquid real assets depends on whether the market reads the shock as inflationary (favoring pricing power) or recessionary (favoring liquidity).
- Data integrity matters more as models depend on it. Delayed Census population estimates lowered household employment by 1.4 million as of December; December payrolls swung from +48,000 to −17,000 on revision; BLS model updates and agency staffing gaps degrade inputs to CRE appraisals, market studies, and credit models.
You can download CREFC's one-page MarketMetrics, which includes statistics covering the economy and the CRE debt capital markets, here.
Contact Raj Aidasani (raidasani@crefc.org) with any questions.